Plotting with amuse
matplotlib
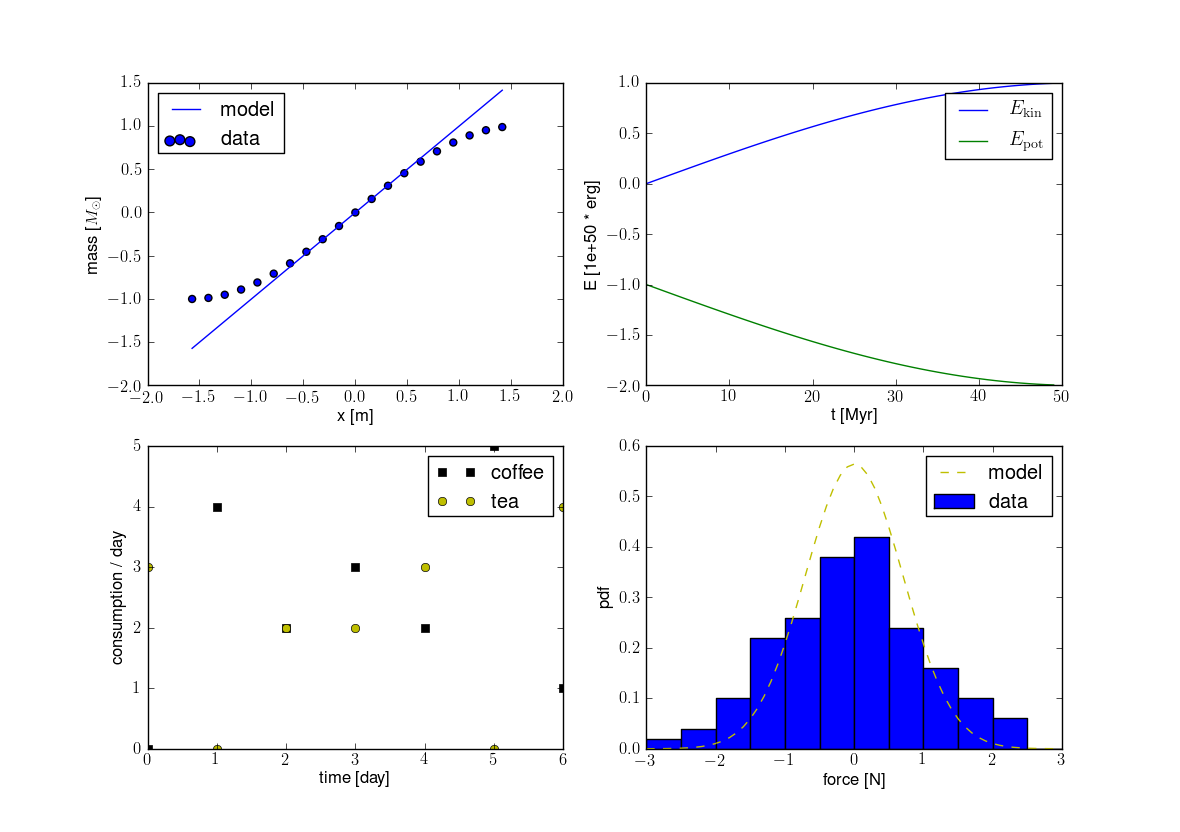
Matplotlib is a python plotting library capable of working with many graphical user interface toolkits. It is not required by AMUSE, but if installed then AMUSE provides extended plot functionality. If a plot is made, axis labels will be made automatically yielding the concerning units.
To use matplotlib within AMUSE with the extended plot functionality you need the following import:
>>> from amuse.plot import *
The native matplotlib plot functions are still available in the native_plot namespace, e.g.:
>>> native_plot.subplot(2,2,1)
install matplotlib
Either use a pre-packaged version or install from source. If you
install from source and you have installed the prerequisites in a
user directory make sure the PATH settings are correct.
The source can be found here
Installation instructions can be found here
Latex support
Latex support for labels can be enabled by issuing:
>>> latex_support()
This command will temporarily change the matplotlibrc settings:
rc('text', usetex=True)
Mathtext
Latex support, while flexible and rich in features, might be slow and requires latex, dvipng and Ghostscript to be installed. You can use matplotlib’s builtin TeX expression parser, mathtext instead. This is a subset TeX markup usable in any matplotlib text string by placing it inside a pair of dollar signs ($). See mathtext for details.
Supported functions
plot
semilogx
semilogy
loglog
scatter
hist
xlabel
ylabel
Example code